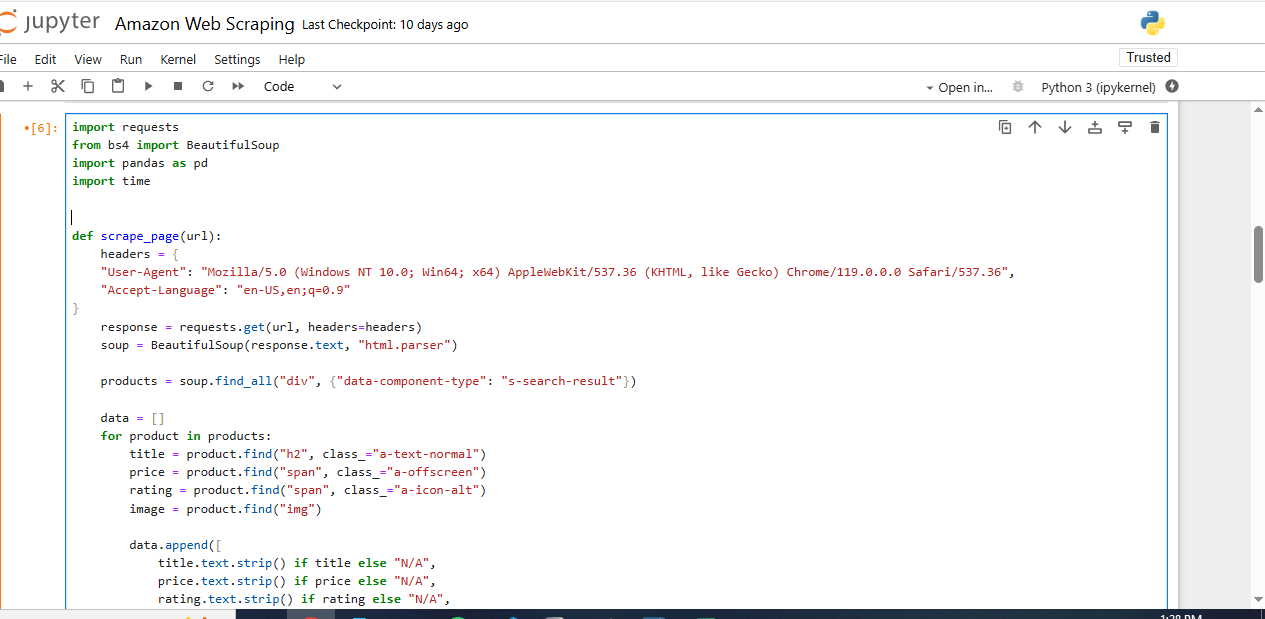
Tools Used: Python (BeautifulSoup, Pandas, Regex), Excel
Scraped and analyzed Amazon laptop listings to uncover pricing, brand, and rating trends. Used Python for web scraping and cleaning, then built a KPI-driven Excel dashboard. Discovered that HP leads in sales, MSI is the most expensive brand, and budget brands often receive strong ratings, showing that high price doesn’t guarantee customer satisfaction. Recommended refining brand classification and promoting high-performing budget options. Demonstrates end-to-end data scraping, preprocessing, and business insight extraction.
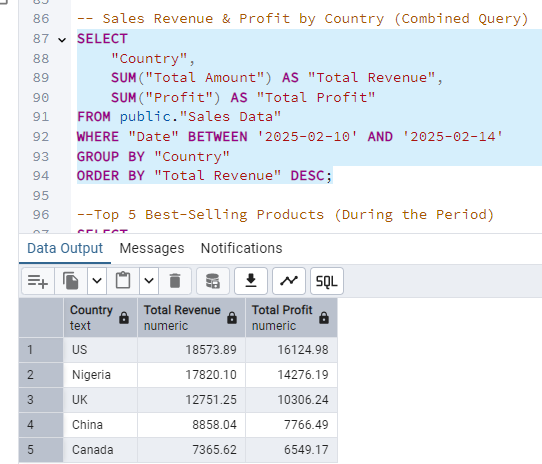
Tools Used: SQL (PostgreSQL), Power BI, Excel
Led a multinational retail sales analysis covering 6 countries, uncovering key insights like a $65K total revenue and $55K profit. Identified top-performing reps and regions (e.g., New York, Abuja), and helped surface underperforming markets like China and Canada. The insights guided regional investment and sales strategy, boosting decision-making speed and enabling location-based pricing optimization.
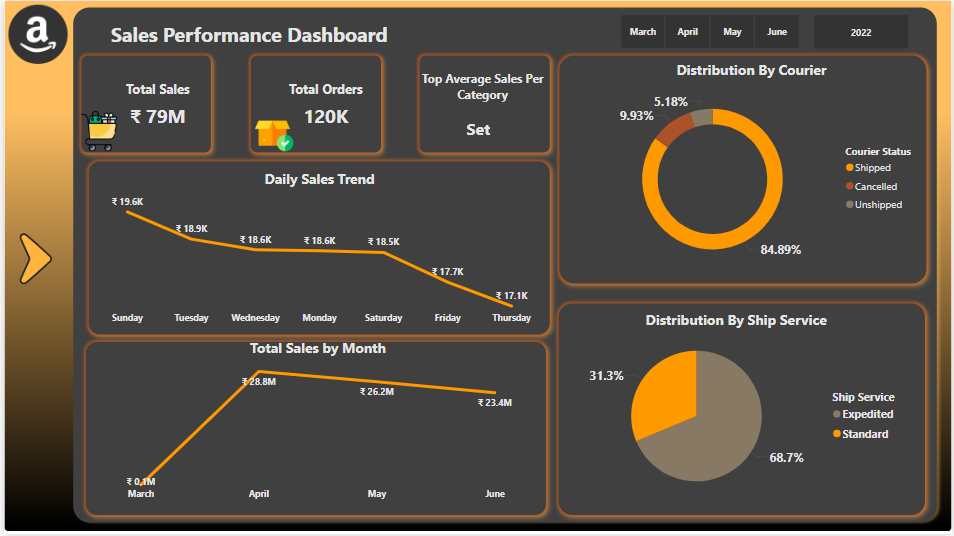
Tools Used: PostgreSQL, Power BI, Excel
Transformed and analyzed over 128K Amazon sales records using SQL and Power BI to uncover insights on sales trends, top cities, shipping efficiency, and return behavior. Identified “Set” as the top-selling category, Bengaluru as the leading city, and Sunday as the most active sales day. Optimized return rate analysis and courier usage patterns. Delivered a Power BI dashboard with interactive visuals, enabling data-driven decisions to improve delivery, reduce costs, and potentially boost revenue by 10–20% in key segments.

Tools Used: Microsoft Excel (Pivot Tables & Charts)
Analyzed Globalshala's Facebook Ads data to uncover high- and low-performing campaigns, audience segments, and geographies. Found that students aged 13–24 drove the best results with 5.1% CTR and $0.90 CPC, while regions like Canada and UK were highly cost-inefficient. Recommendations included reallocating budget to high-performing regions like India and Nigeria, and discontinuing underperforming campaigns. The project demonstrates real-world marketing analytics, Excel dashboarding, and strategic budget optimization.
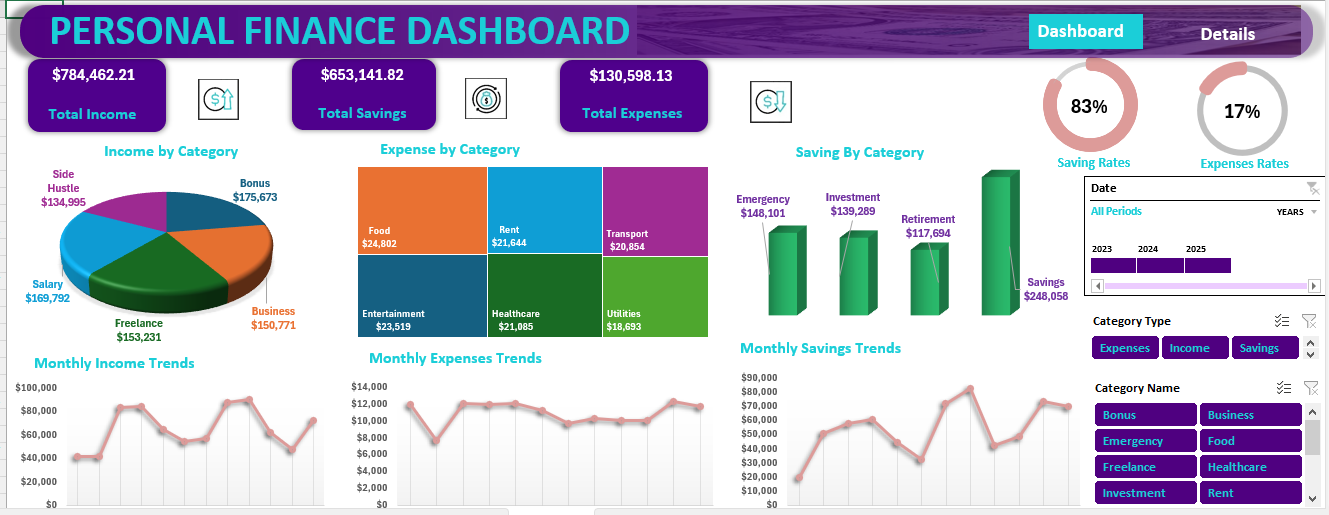
Tools Used: Microsoft Excel (Pivot Tables & Charts)
This Excel-based finance tracker consolidates income, expenses, and savings into an interactive dashboard. Built with Power Pivot, slicers, timelines, and calculated KPIs, it offers clear visual insights into financial trends and behaviors. With features like dynamic filtering and category-level analysis, the dashboard helps users monitor financial health and make smarter money decisions. Skills demonstrated include advanced Excel modeling, KPI design, and data storytelling.